

Mermaid.js: How to Create Diagrams for Documentation Using Text
Recently, I had to write documentation for a large project with a fairly complex structure.
Documentation itself doesn’t seem like such a difficult task anymore. With the help of AI, you can get a good understanding of even a large project relatively quickly. The important part is to clearly explain what you want to get as a result, plan the documentation structure, and provide the AI with enough context.
But there is another problem.
It’s not always convenient to describe a complex architecture using text alone.
As the saying goes, a picture is worth a thousand words.
This is especially true when dealing with components that have many dependencies, lots of connections, or a fairly complex execution flow.
How do you draw a diagram?
The simplest option is plain ASCII:
User
|
v
Controller
|
v
Service
| \
|  v
| Repository
v
Queue
|
v
Worker
It works. For a small diagram, it can be perfectly fine.
But as the architecture becomes more complex, these diagrams become harder to read.
Another option is to use a graphical editor and draw a proper diagram.
The result will be much more visual: blocks, arrows, colors, and different types of elements.
The problem starts later — you have to maintain the diagram.
The project changes, a new dependency or component appears, and you have to open the graphical editor again, add the new elements, move things around, adjust the arrows, and save a new version.
After a while, the diagram can easily start living its own life and no longer reflect the actual state of the project.
And this is where I discovered a rather interesting tool — Mermaid.js.
Mermaid — diagrams from text
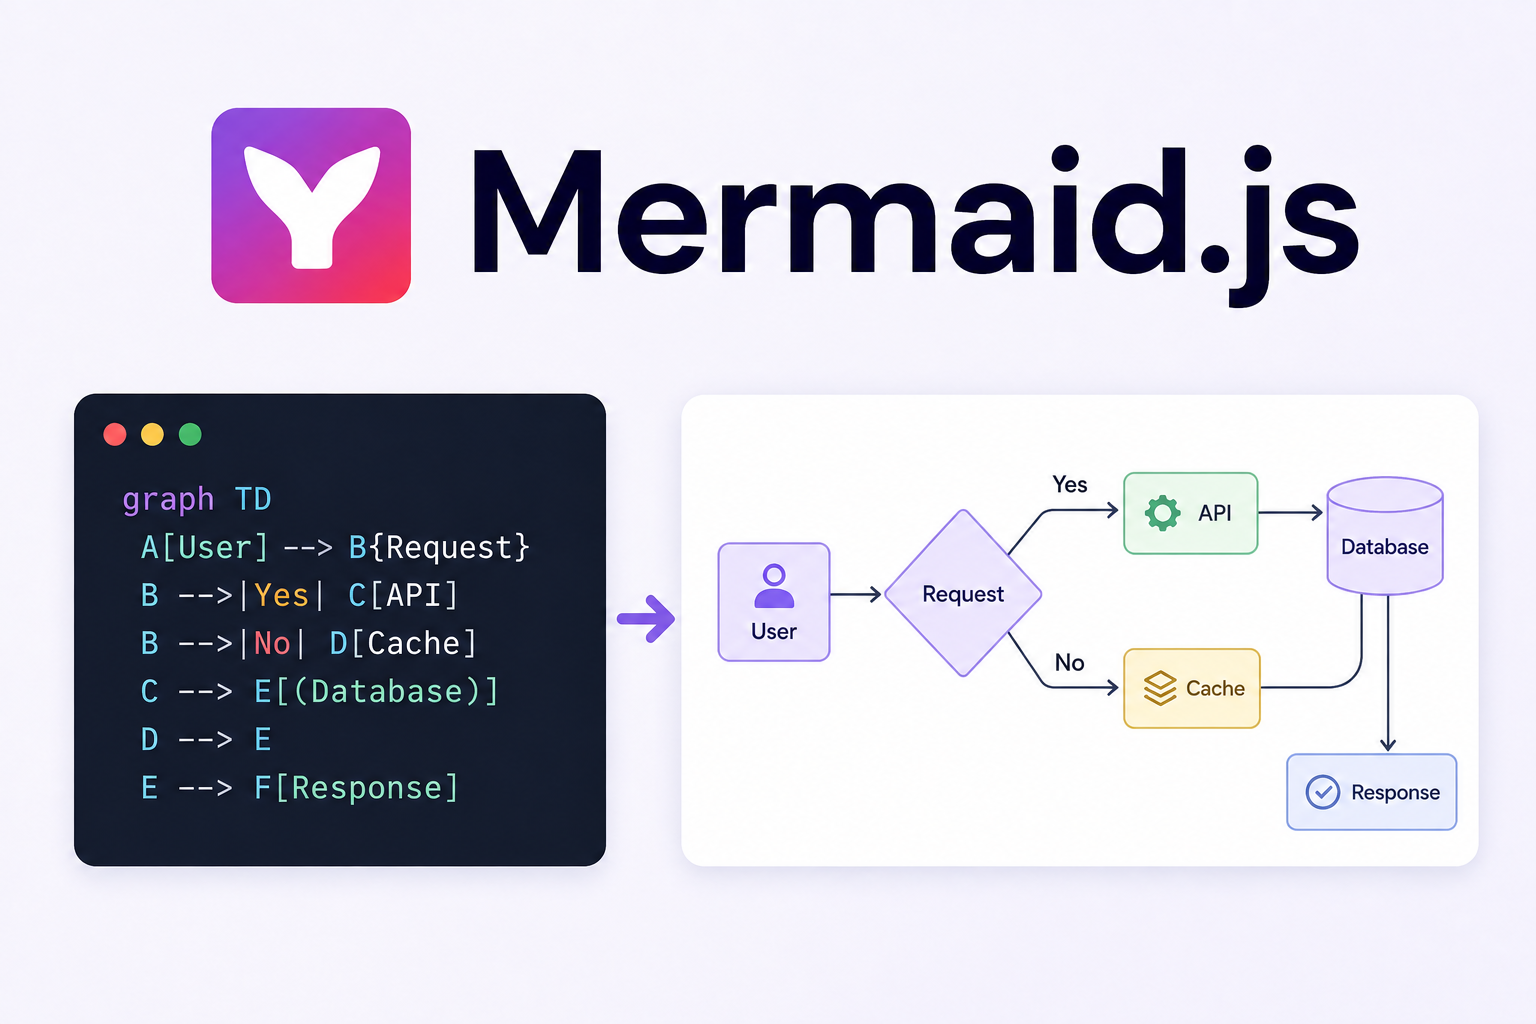
The idea behind Mermaid is quite simple: instead of drawing a diagram with a mouse, you describe it using plain text.
For example:
flowchart TD
    User --> Controller
    Controller --> Service
    Service --> Repository
    Service --> Queue
    Queue --> Worker
Mermaid uses this description to generate the diagram.
And the best part is that you don’t have to redraw anything when the diagram changes.
For example, suppose the project now has a Cache:
flowchart TD
    User --> Controller
    Controller --> Service
    Service --> Repository
    Service --> Queue
    Service --> Cache
    Queue --> Worker
Add one line, and the diagram changes.
It may sound like a small thing, but once you start working with larger diagrams, being able to edit them as plain text becomes very convenient.
Mermaid is more than just flowcharts
Mermaid isn’t just a flowchart generator. It supports quite a few different types of diagrams.
For example:
flowcharts;
sequence diagrams;
class diagrams;
state diagrams;
ER diagrams;
Git graphs;
architecture diagrams and more.
For example, a sequence diagram:
sequenceDiagram
    User->>API: Request
    API->>Service: Process request
    Service->>Database: Query
    Database-->>Service: Data
    Service-->>API: Result
    API-->>User: Response
Or a simple state diagram:
stateDiagram-v2
    [*] --> Draft
    Draft --> Published
    Published --> Archived
    Archived --> [*]
So with a single tool, you can describe not only the structure of a system, but also processes, sequences of actions, and object states.
What does AI have to do with it?
In my opinion, this is where Mermaid becomes particularly interesting.
Since diagrams are described using text, they are very convenient to generate with AI.
I don’t necessarily have to remember Mermaid’s syntax or manually describe a large diagram. I can give AI a description of the architecture or a specific process and ask:
Create a Mermaid sequence diagram showing how these components interact.
The result is ready-to-use code that can be reviewed, slightly adjusted, and added to the documentation.
The process is quite simple:
Project
   ↓
AI analyzes the structure
   ↓
AI generates Mermaid
   ↓
Developer reviews and adjusts it
   ↓
The diagram becomes part of the documentation
I still wouldn’t rely on AI without reviewing the result. A generated diagram can look perfectly convincing while containing an incorrect relationship or missing a component.
So, in this case, AI works particularly well for quickly creating the first version of a diagram.
The biggest advantage — the diagram becomes code
For me, this is probably Mermaid’s biggest advantage.
A diagram is just text that can be stored in Markdown alongside the rest of the documentation.
And that means Git can understand its changes perfectly well.
For example, a diff can show:
Service --> Repository
Service --> Queue
+Service --> Cache
You can immediately see what changed in the architecture.
You can commit it, review the diff, include it in code review, roll changes back, and keep the entire history.
And when the project architecture changes, you only need to modify a few lines of Mermaid code.
There is no need to open a graphical editor and rearrange all the elements again.
Where can you use it?
Mermaid works particularly well for documentation that is stored alongside the source code.
For example, documentation can be kept in a Markdown file:
## Order processing

The order is processed through the following components:

```mermaid
flowchart LR
    API --> OrderService
    OrderService --> Payment
    OrderService --> Queue
    Queue --> Worker
```
This way, the process description and the diagram live in the same place and can be changed together with the code.
Mermaid is also supported by popular development and documentation tools.
For example, GitHub supports Mermaid natively. There is a separate plugin for PhpStorm, and Bitbucket also supports Mermaid.
This makes Mermaid particularly convenient for teams that keep their documentation directly in the repository.
Final thoughts
For me, Mermaid turned out to be a fairly simple but useful tool.
I think that when writing documentation for complex projects, it’s useful to show not only what a component does, but also how it is connected to other components and how the execution flow works.
Mermaid makes it possible to turn such a diagram into part of the documentation itself, rather than a separate image that was created once and then forgotten.
Combined with AI, it becomes a pretty convenient tool for developers.